This search combines search strings from the content search (i.e. "Full Text", "Author", "Title", "Abstract", or "Keywords") with "Article Type" and "Publication Date Range" using the AND operator.
Beilstein J. Nanotechnol. 2024, 15, 57–70, doi:10.3762/bjnano.15.6
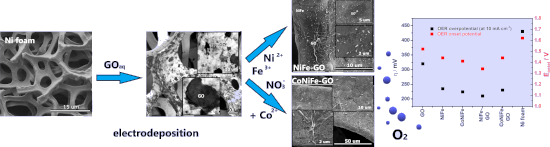
Figure 1: SEM micrographs of freeze-dried nanostructures of pure (a, d) and composite hydrogel samples: Hgel-...
Figure 2: EDS analysis of hydrogel composites: Hgel-MCO (a, d, g), Hgel-MCO-cCB 1:3 (b, e, h), Hgel-MCO-cCB 1...
Figure 3: Transmittance plot in the function of wavenumber based on absorbance data from FTIR-ATR spectra of ...
Figure 4: Analysis of electrical properties of hydrogel-based samples with catalyst (M CO) and conductive (cC...
Figure 5: Catalytic activity in the OER process of MCO particles dispersed in the hydrogel: a) polarisation c...
Figure 6: Scheme of hydrogel polymerisation process with electrocatalyst and conductive carbon particles.
Figure 7: System for measuring electrical properties of hydrogel-based samples with catalyst (MCO) and conduc...
Beilstein J. Nanotechnol. 2023, 14, 420–433, doi:10.3762/bjnano.14.34
Figure 1: Chronoamperometric graphs recorded during electrochemical deposition of the catalysts on nickel foa...
Figure 2: SEM images and corresponding EDX maps of NiFe (a), NiFe-GO (b), CoNiFe (c), and CoNiFe-GO (d) depos...
Figure 3: Normalized XAS spectra (a–d) and XRD patterns (e) of NiFe, CoNiFe, NiFe-GO, and CoNiFe-GO.
Figure 4: XPS high-resolution spectra of Ni 2p (a), Fe 2p (b), Co 2p (c), and C 1s (d) levels of the catalyst...
Figure 5: Linear scan voltammetry profiles (a) with corresponding evolutions of the OER overpotential η (10 m...
Figure 6: Linear scan voltammetry profiles (a) with corresponding Tafel plots (b) and evolution of the OER ov...
Figure 7: Linear scan voltammetry profiles (a) with corresponding Tafel plots (b) and evolution of the OER ov...
Figure 8: Chronopotentiometric curves recorded in aqueous solution of 1 M KOH at 10 mA∙cm−2geo (a) and SEM im...